 zuolingfeng
Web Gis开发 Openlayers
npm install ol
https://openlayers.org/en/latest/apidoc/module-ol_Map-Map.html
Openlayers 初始化高德地图
HTML
<template>
<!-- 地图控制按钮区域 -->
<div class="disGIS">
<el-button @click="btn1">矢量路网</el-button>
<el-button @click="btn2">影像图</el-button>
<el-button @click="btn3">点聚合</el-button>
</div>
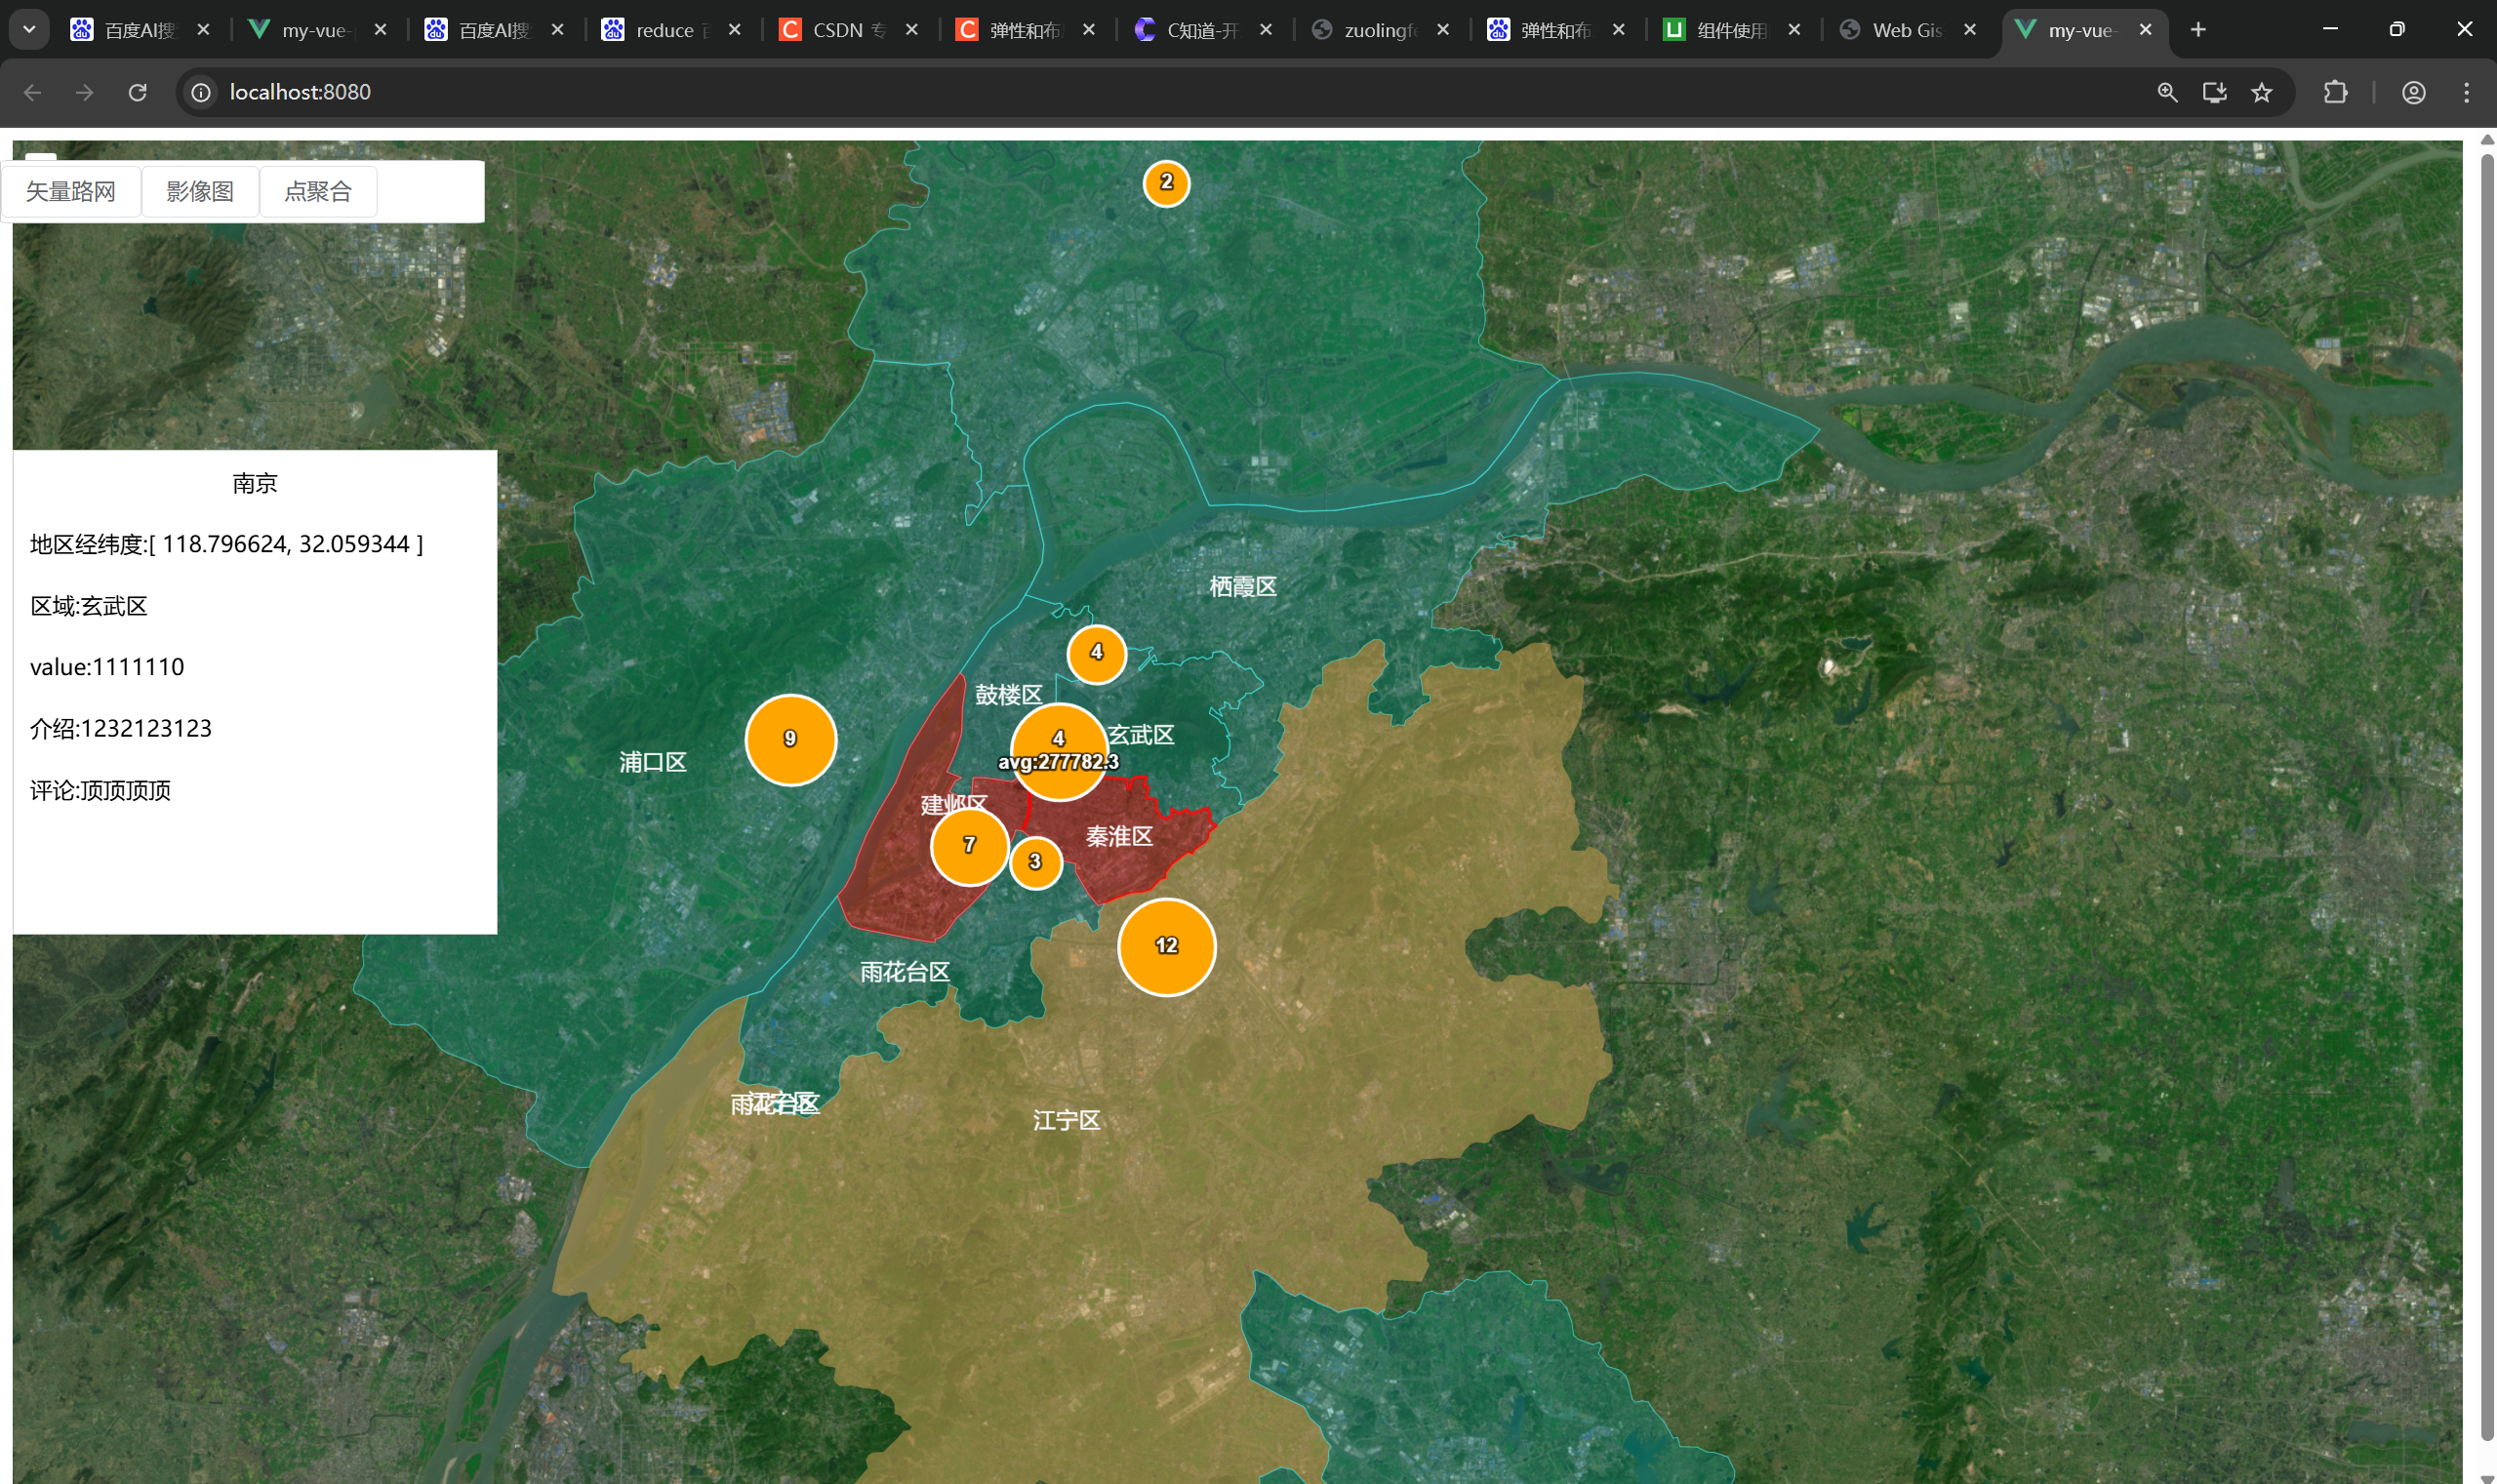
<div class="pos" v-show="showOpenLayers">
<div style="text-align:center">{{ clickedFeatureValue.name }}</div>
<div>地区经纬度:{{ [clickedFeatureValue.lon, clickedFeatureValue.lat] }}</div>
<div>区域:{{ clickedFeatureValue.city }}</div>
<div>value:{{ clickedFeatureValue.value }}</div>
<div>介绍:{{ clickedFeatureValue.title }}</div>
<div>评论:{{ clickedFeatureValue.zxcv }}</div>
</div>
<!-- 地图容器 -->
<div id="map" style="width: 100%; height: 100vh;"></div>
</template>
<script setup>
import GetMap from '../components/GetMap.js'
import "ol/ol.css";
import Map from "ol/Map";
import OSM from "ol/source/OSM";
import TileLayer from "ol/layer/Tile";
import View from "ol/View";
import XYZ from 'ol/source/XYZ';
import { fromLonLat } from 'ol/proj';
import VectorLayer from 'ol/layer/Vector'
import VectorSource from 'ol/source/Vector'
import Feature from 'ol/Feature'
import Overlay from 'ol/Overlay'
import Point from 'ol/geom/Point'
import { Style, Fill, Stroke, Circle } from 'ol/style'
import GeoJSON from 'ol/format/GeoJSON'
import { Text } from 'ol/style'
import Cluster from 'ol/source/Cluster';
import { ref, computed, onMounted } from 'vue'
const showOpenLayers = ref(false)
const cityNanJing = ref([{}])
const URL = ref('http://wprd0{1-4}.is.autonavi.com/appmaptile?x={x}&y={y}&z={z}&lang=zh_cn&size=1&scl=1&style=7')
let gaodeMapLayer = null;
const ShowGis = ref('图层');
const baseLayer = ref()
const vectorLayer = ref()
const APICity = ref([])
const showPopup = false
const clickedFeatureValue = ref('')
const clickedFeature = ref(null)
const clickedCoordinate = ref('')
// 点数据
const points = ref([
{ lon: 118.796624, lat: 32.059344, value: 1111110, name: '南京', city:'玄武区',title: '1232123123', zxcv: '顶顶顶顶', show: '1' },
{ lon: 118.792199, lat: 32.050678, value: 5, show: '1' },
{ lon: 118.786088, lat: 32.033818, value: 8, show: '1' },
{ lon: 118.732688, lat: 32.004538, value: 7, show: '1' },
{ lon: 118.769739, lat: 32.066966, value: 6, show: '1' },
{ lon: 118.625307, lat: 32.05839, value: 9, show: '1' },
{ lon: 118.808702, lat: 32.102147, value: 4, show: '1' },
{ lon: 118.77207, lat: 31.995946, value: 3, show: '1' },
{ lon: 118.850621, lat: 31.953418, value: 12, show: '1' },
{ lon: 118.85065, lat: 32.340655, value: 2, show: '1' }
]);
const btn1 = () => {
ShowGis.value = '图层'
Gis_init()
}
const btn2 = () => {
ShowGis.value = '影像图'
Gis_init()
}
const btn3 = () => {
// 移除可能已存在的聚类图层
const layers = gaodeMapLayer.getLayers().getArray();
for (let i = layers.length - 1; i >= 0; i--) {
if (layers[i].get('name') === 'clusterLayer') {
gaodeMapLayer.removeLayer(layers[i]);
}
}
// 创建点要素
const features = points.value.map(point => {
const feature = new Feature({
geometry: new Point(fromLonLat([point.lon, point.lat])),
value: point.value,
feature1: point,// 这里的获取值的关键
});
return feature;
});
// 创建矢量源并添加点要素
const source = new VectorSource({
features: features
});
// 创建聚类源
const clusterSource = new Cluster({
distance: 40, // 聚合距离(像素)
source: source
});
// 创建聚类图层
const clusterLayer = new VectorLayer({
source: clusterSource,
style: function (feature) {
const size = feature.get('features').length;
const features = feature.get('features');
const avgValue = features.reduce((sum, f) => sum + f.get('value'), 0) / size;
// 根据平均值计算半径
const radius = Math.min(10 + avgValue * 2, 30);
let displayText = '';
if (size > 1) {
displayText = `${size}\navg:${avgValue.toFixed(1)}`; // 聚合点显示数量和平均值
} else {
displayText = features[0].get('value').toString(); // 单点显示原始值
}
return new Style({
image: new Circle({
radius: radius,
fill: new Fill({
color: 'orange'
}),
stroke: new Stroke({
color: 'white',
width: 2
})
}),
text: new Text({
text: displayText,
font: 'bold 12px Arial',
fill: new Fill({
color: '#fff'
}),
stroke: new Stroke({
color: 'rgba(0,0,0,0.7)',
width: 3
}),
textAlign: 'center',
textBaseline: 'middle',
offsetY: 0
})
});
},
name: 'clusterLayer' // 为图层添加标识
});
// 添加到地图
gaodeMapLayer.addLayer(clusterLayer)
// GIS点击事件获取你当前的值 feature1: point,// 这里的获取值的关键
gaodeMapLayer.on('singleclick', (e) => {
// console.log(feature,'走了!')
gaodeMapLayer.forEachFeatureAtPixel(e.pixel, (feature) => {
console.log(feature, 'feature')
if (!feature?.values_.features) {
showOpenLayers.value = false
return false // 确保只处理第一个匹配要素
} else {
if (feature) {
clickedFeatureValue.value = feature?.values_?.features[0]?.values_?.feature1
// const coord = feature.getGeometry().getCoordinates()
// clickedCoordinate.value = `经度: ${coord[0].toFixed(6)}, 纬度: ${coord[1].toFixed(6)}`
// clickedFeatureValue.value = feature.get('feature') // 确保属性名一致
// clickedFeatureValue.value = feature.get('feature1') // 确保属性名一致
showOpenLayers.value = true
return true // 确保只处理第一个匹配要素
}
}
})
})
}
const Gis_init = () => {
GetMap.then(res => {
res.data.features.forEach((item, index) => {
APICity.value.push(item.properties.center)
});
if (gaodeMapLayer) {
gaodeMapLayer.dispose();
}
const source = new XYZ({
url: ShowGis.value === '图层' ? 'http://wprd0{1-4}.is.autonavi.com/appmaptile?x={x}&y={y}&z={z}&lang=zh_cn&size=1&scl=1&style=7'
: 'http://wprd0{1-4}.is.autonavi.com/appmaptile?x={x}&y={y}&z={z}&lang=zh_cn&size=1&scl=2&style=6',
wrapX: false,
})
const layer = new TileLayer({
source: source
})
// 严格使用points.value创建要素
const features = points.value.map(point => {
const feature = new Feature({
geometry: new Point(fromLonLat([point.lon, point.lat])),
originalValue: point.value // 使用统一属性名
})
return feature
})
console.log(features, 'featuresfeaturesfeatures')
vectorLayer.value = new VectorLayer({
source: new VectorSource({
url: 'https://geo.datav.aliyun.com/areas_v3/bound/320100_full.json',
format: new GeoJSON(),
// features:features,
}),
style: function (feature) {
const name = feature.get('name');
// 定义要高亮的区域列表
const highlightAreas = ['秦淮区', '建邺区']; // 替换为你需要高亮的区域
const highlightAreas1 = ['江宁区',]; // 替换为你需要高亮的区域
if (highlightAreas.includes(name)) {
// 高亮样式
return new Style({
fill: new Fill({ color: 'rgba(255, 0, 0, 0.347)' }), // 红色高亮
stroke: new Stroke({ color: 'rgba(255, 0, 0, 0.8)', width: 2 }),
text: new Text({
text: name,
font: '14px Calibri,sans-serif',
fill: new Fill({ color: 'white' }),
overflow: true
})
});
} else if (highlightAreas1.includes(name)) {
// 高亮样式
return new Style({
fill: new Fill({ color: '#c59d528a' }), // 红色高亮
// stroke: new Stroke({ color: 'white', width:0 }),
text: new Text({
text: name,
font: '14px Calibri,sans-serif',
fill: new Fill({ color: 'white' }),
overflow: true
})
});
} else {
// 默认样式
return new Style({
fill: new Fill({ color: 'rgba(0, 153, 148, 0.3)' }),
stroke: new Stroke({ color: 'rgba(73, 242, 242, 0.8)', width: 0.5 }),
text: new Text({
text: name,
font: '14px Calibri,sans-serif',
fill: new Fill({ color: 'white' }),
overflow: true
})
});
}
// return new Style({
// fill: new Fill({ color: 'rgba(0, 153, 148, 0.3)' }),
// stroke: new Stroke({ color: 'rgba(73, 242, 242, 0.8)', width: 1 }),
// text: new Text({
// text: feature.get('name'),
// font: '14px Calibri,sans-serif',
// fill: new Fill({ color: 'white' }),
// overflow: true
// })
// });
}
})
gaodeMapLayer = new Map({
target: 'map',
layers: ShowGis.value == '影像图' ? [layer, vectorLayer.value] : [layer],
view: new View({
center: fromLonLat([118.796624, 32.059344]),
zoom: 10,
projection: 'EPSG:3857',
}),
});
})
}
onMounted(() => {
Gis_init()
})
</script>
<style scoped lang="scss">
.disGIS {
position: relative;
position: fixed;
top: 20px;
left: 0;
width: 300px;
border: 1px solid #ccc;
background: white;
border-radius: 3%;
z-index: 999;
background: white;
}
.el-button {}
::v-deep .el-button+.el-button {
margin: 3px 0;
}
.pos {
position: absolute;
top: 200px;
z-index: 999;
width: 300px;
height: 300px;
border: 1px solid #ccc;
background: white;
display: flex;
flex-direction: column;
div {
padding: 10px;
}
}
</style>
<template>
    <!-- 地图控制按钮区域 -->
    <div class="disGIS">
        <el-button @click="btn1">矢量路网</el-button>
        <el-button @click="btn2">影像图</el-button>
        <el-button @click="btn3">点聚合</el-button>
    </div>
    <div class="pos" v-show="showOpenLayers">
        <div style="text-align:center">{{ clickedFeatureValue.name }}</div>
        <div>地区经纬度:{{ [clickedFeatureValue.lon, clickedFeatureValue.lat] }}</div>
        <div>区域:{{ clickedFeatureValue.city }}</div>
        <div>value:{{ clickedFeatureValue.value }}</div>
        <div>介绍:{{ clickedFeatureValue.title }}</div>
        <div>评论:{{ clickedFeatureValue.zxcv }}</div>


    </div>
    <!-- 地图容器 -->
    <div id="map" style="width: 100%; height: 100vh;"></div>
</template>

<script setup>
import GetMap from '../components/GetMap.js'
import "ol/ol.css";
import Map from "ol/Map";
import OSM from "ol/source/OSM";
import TileLayer from "ol/layer/Tile";
import View from "ol/View";
import XYZ from 'ol/source/XYZ';
import { fromLonLat } from 'ol/proj';
import VectorLayer from 'ol/layer/Vector'
import VectorSource from 'ol/source/Vector'
import Feature from 'ol/Feature'
import Overlay from 'ol/Overlay'

import Point from 'ol/geom/Point'
import { Style, Fill, Stroke, Circle } from 'ol/style'
import GeoJSON from 'ol/format/GeoJSON'
import { Text } from 'ol/style'
import Cluster from 'ol/source/Cluster';
import { ref, computed, onMounted } from 'vue'
const showOpenLayers = ref(false)
const cityNanJing = ref([{}])
const URL = ref('http://wprd0{1-4}.is.autonavi.com/appmaptile?x={x}&y={y}&z={z}&lang=zh_cn&size=1&scl=1&style=7')
let gaodeMapLayer = null;
const ShowGis = ref('图层');
const baseLayer = ref()
const vectorLayer = ref()
const APICity = ref([])
const showPopup = false
const clickedFeatureValue = ref('')
const clickedFeature = ref(null)
const clickedCoordinate = ref('')
// 点数据
const points = ref([
    { lon: 118.796624, lat: 32.059344, value: 1111110, name: '南京', city:'玄武区',title: '1232123123', zxcv: '顶顶顶顶', show: '1' },
    { lon: 118.792199, lat: 32.050678, value: 5, show: '1' },
    { lon: 118.786088, lat: 32.033818, value: 8, show: '1' },
    { lon: 118.732688, lat: 32.004538, value: 7, show: '1' },
    { lon: 118.769739, lat: 32.066966, value: 6, show: '1' },
    { lon: 118.625307, lat: 32.05839, value: 9, show: '1' },
    { lon: 118.808702, lat: 32.102147, value: 4, show: '1' },
    { lon: 118.77207, lat: 31.995946, value: 3, show: '1' },
    { lon: 118.850621, lat: 31.953418, value: 12, show: '1' },
    { lon: 118.85065, lat: 32.340655, value: 2, show: '1' }
]);
const btn1 = () => {
    ShowGis.value = '图层'
    Gis_init()
}
const btn2 = () => {
    ShowGis.value = '影像图'
    Gis_init()
}
const btn3 = () => {
    // 移除可能已存在的聚类图层
    const layers = gaodeMapLayer.getLayers().getArray();
    for (let i = layers.length - 1; i >= 0; i--) {
        if (layers[i].get('name') === 'clusterLayer') {
            gaodeMapLayer.removeLayer(layers[i]);
        }
    }
    // 创建点要素
    const features = points.value.map(point => {
        const feature = new Feature({
            geometry: new Point(fromLonLat([point.lon, point.lat])),
            value: point.value,
            feature1: point,//   这里的获取值的关键
        });
        return feature;
    });
    // 创建矢量源并添加点要素
    const source = new VectorSource({
        features: features
    });

    // 创建聚类源
    const clusterSource = new Cluster({
        distance: 40, // 聚合距离(像素)
        source: source
    });
    // 创建聚类图层
    const clusterLayer = new VectorLayer({
        source: clusterSource,
        style: function (feature) {
            const size = feature.get('features').length;
            const features = feature.get('features');
            const avgValue = features.reduce((sum, f) => sum + f.get('value'), 0) / size;

            // 根据平均值计算半径
            const radius = Math.min(10 + avgValue * 2, 30);
            let displayText = '';
            if (size > 1) {
                displayText = `${size}\navg:${avgValue.toFixed(1)}`; // 聚合点显示数量和平均值
            } else {
                displayText = features[0].get('value').toString(); // 单点显示原始值
            }
            return new Style({
                image: new Circle({
                    radius: radius,
                    fill: new Fill({
                        color: 'orange'
                    }),
                    stroke: new Stroke({
                        color: 'white',
                        width: 2
                    })
                }),
                text: new Text({
                    text: displayText,
                    font: 'bold 12px Arial',
                    fill: new Fill({
                        color: '#fff'
                    }),
                    stroke: new Stroke({
                        color: 'rgba(0,0,0,0.7)',
                        width: 3
                    }),
                    textAlign: 'center',
                    textBaseline: 'middle',
                    offsetY: 0
                })
            });
        },
        name: 'clusterLayer' // 为图层添加标识
    });

    // 添加到地图
    gaodeMapLayer.addLayer(clusterLayer)

    // GIS点击事件获取你当前的值    feature1: point,//   这里的获取值的关键
    gaodeMapLayer.on('singleclick', (e) => {
        // console.log(feature,'走了!')
        gaodeMapLayer.forEachFeatureAtPixel(e.pixel, (feature) => {
            console.log(feature, 'feature')
            if (!feature?.values_.features) {
                showOpenLayers.value = false
                return false // 确保只处理第一个匹配要素

            } else {
                if (feature) {
                    clickedFeatureValue.value = feature?.values_?.features[0]?.values_?.feature1
                    // const coord = feature.getGeometry().getCoordinates()
                    // clickedCoordinate.value = `经度: ${coord[0].toFixed(6)}, 纬度: ${coord[1].toFixed(6)}`
                    // clickedFeatureValue.value = feature.get('feature') // 确保属性名一致
                    // clickedFeatureValue.value = feature.get('feature1') // 确保属性名一致
                    showOpenLayers.value = true
                    return true // 确保只处理第一个匹配要素
                }
            }
        })
    })


}
const Gis_init = () => {
    GetMap.then(res => {
        res.data.features.forEach((item, index) => {
            APICity.value.push(item.properties.center)
        });
        if (gaodeMapLayer) {
            gaodeMapLayer.dispose();
        }

        const source = new XYZ({
            url: ShowGis.value === '图层' ? 'http://wprd0{1-4}.is.autonavi.com/appmaptile?x={x}&y={y}&z={z}&lang=zh_cn&size=1&scl=1&style=7'
                : 'http://wprd0{1-4}.is.autonavi.com/appmaptile?x={x}&y={y}&z={z}&lang=zh_cn&size=1&scl=2&style=6',
            wrapX: false,
        })

        const layer = new TileLayer({
            source: source
        })
        // 严格使用points.value创建要素
        const features = points.value.map(point => {
            const feature = new Feature({
                geometry: new Point(fromLonLat([point.lon, point.lat])),
                originalValue: point.value // 使用统一属性名
            })
            return feature
        })
        console.log(features, 'featuresfeaturesfeatures')
        vectorLayer.value = new VectorLayer({
            source: new VectorSource({
                url: 'https://geo.datav.aliyun.com/areas_v3/bound/320100_full.json',
                format: new GeoJSON(),
                // features:features,
            }),
            style: function (feature) {
                const name = feature.get('name');
                // 定义要高亮的区域列表
                const highlightAreas = ['秦淮区', '建邺区']; // 替换为你需要高亮的区域
                const highlightAreas1 = ['江宁区',]; // 替换为你需要高亮的区域

                if (highlightAreas.includes(name)) {
                    // 高亮样式
                    return new Style({
                        fill: new Fill({ color: 'rgba(255, 0, 0, 0.347)' }), // 红色高亮
                        stroke: new Stroke({ color: 'rgba(255, 0, 0, 0.8)', width: 2 }),
                        text: new Text({
                            text: name,
                            font: '14px Calibri,sans-serif',
                            fill: new Fill({ color: 'white' }),
                            overflow: true
                        })
                    });
                } else if (highlightAreas1.includes(name)) {
                    // 高亮样式
                    return new Style({
                        fill: new Fill({ color: '#c59d528a' }), // 红色高亮
                        // stroke: new Stroke({ color: 'white', width:0 }),
                        text: new Text({
                            text: name,
                            font: '14px Calibri,sans-serif',
                            fill: new Fill({ color: 'white' }),
                            overflow: true
                        })
                    });
                } else {
                    // 默认样式
                    return new Style({
                        fill: new Fill({ color: 'rgba(0, 153, 148, 0.3)' }),
                        stroke: new Stroke({ color: 'rgba(73, 242, 242, 0.8)', width: 0.5 }),
                        text: new Text({
                            text: name,
                            font: '14px Calibri,sans-serif',
                            fill: new Fill({ color: 'white' }),
                            overflow: true
                        })
                    });
                }
                // return new Style({
                //     fill: new Fill({ color: 'rgba(0, 153, 148, 0.3)' }),
                //     stroke: new Stroke({ color: 'rgba(73, 242, 242, 0.8)', width: 1 }),
                //     text: new Text({
                //         text: feature.get('name'),
                //         font: '14px Calibri,sans-serif',
                //         fill: new Fill({ color: 'white' }),
                //         overflow: true
                //     })
                // });
            }
        })
        gaodeMapLayer = new Map({
            target: 'map',
            layers: ShowGis.value == '影像图' ? [layer, vectorLayer.value] : [layer],
            view: new View({
                center: fromLonLat([118.796624, 32.059344]),
                zoom: 10,
                projection: 'EPSG:3857',
            }),
        });
    })
}

onMounted(() => {
    Gis_init()
})
</script>

<style scoped lang="scss">
.disGIS {
    position: relative;
    position: fixed;
    top: 20px;
    left: 0;
    width: 300px;
    border: 1px solid #ccc;
    background: white;
    border-radius: 3%;
    z-index: 999;
    background: white;
}

.el-button {}

::v-deep .el-button+.el-button {
    margin: 3px 0;
}

.pos {
    position: absolute;
    top: 200px;
    z-index: 999;
    width: 300px;
    height: 300px;
    border: 1px solid #ccc;
    background: white;
    display: flex;
    flex-direction: column;

    div {
        padding: 10px;
    }
}
</style>