 zuolingfeng
阿里云数据可视化
API: https://datav.aliyun.com/portal/school/atlas/area_selector
HTML
    准备API 地图数据
    import axios from 'axios'
    export default axios.get('可视化地图数据API')
准备API 地图数据
import axios from 'axios'
export default axios.get('可视化地图数据API')HTML
    准备容器
   <template>
  <div style="width:800px;height:600px" ref="chartRef"></div>
</template>
    在把引入一些需要的依赖 如:Echarts、getMapAPI(地图数据)
    import * as echarts from 'echarts';
    import getMapAPI from './api/getMapAPI';
准备容器
<template>
<div style="width:800px;height:600px" ref="chartRef"></div>
</template>
在把引入一些需要的依赖 如:Echarts、getMapAPI(地图数据)
import * as echarts from 'echarts';
import getMapAPI from './api/getMapAPI';js
<script setup>
import { ref, onMounted, onBeforeUnmount } from 'vue'
import * as echarts from 'echarts'
import GetMap from '../components/GetMap.js'
const chartRef = ref(null)
// 中国主要城市坐标数据
// 打点
const cityData = ref([])
// 坐标
const coordinates = ref([])
// 值
const optionCity = ref([])
const colorList = ['#D88BFF', '#5abead', '#66FFFF', '#48D5FF', '#FFE73D', '#66FFFF']
const dataList = ref([])
onMounted(async () => {
var myChart = echarts.init(chartRef.value)
// 显示 loading 动画
myChart.showLoading()
GetMap.then(res => {
// 执行接口关闭动画
myChart.hideLoading()
// 注册地图数据
echarts.registerMap('JSS', res.data)
console.log(res.data.features, 'res.data.features');
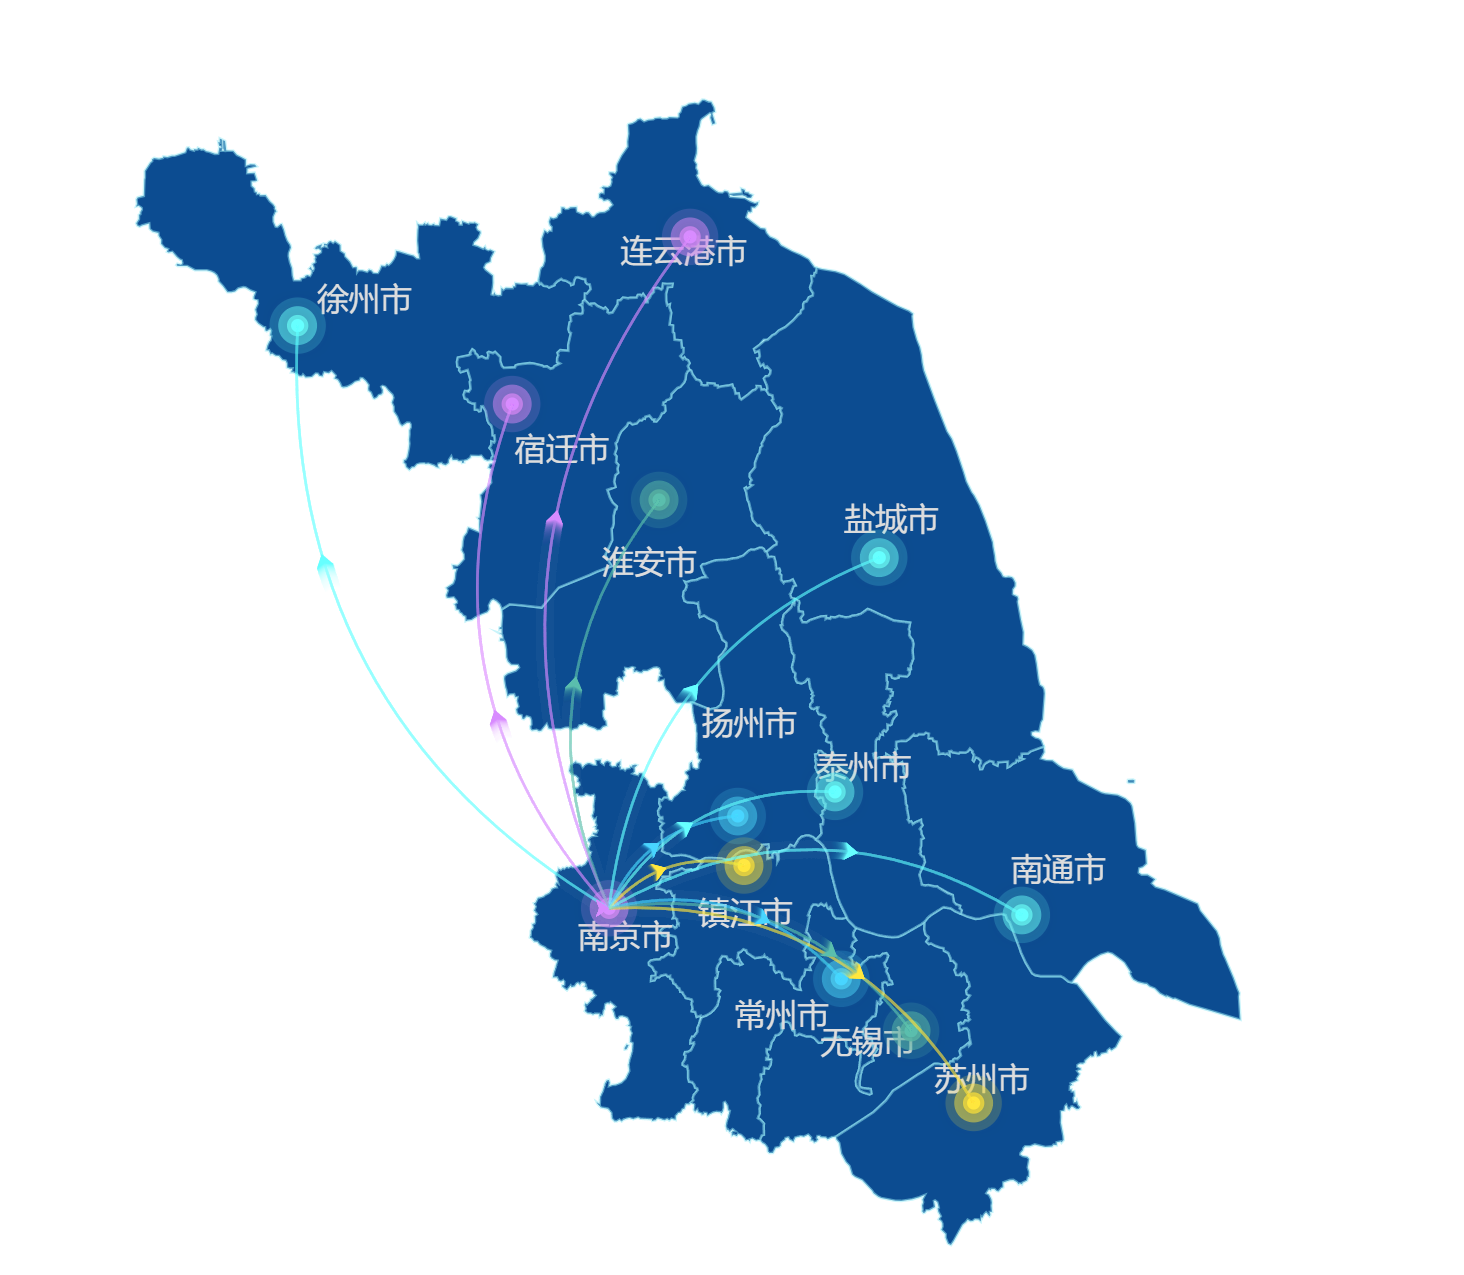
// 南京位中心,
let nanJingData = res.data.features[0].properties.center
// 获取每一个城市的坐标,在已南京为中心打点
optionCity.value = res.data.features
optionCity.value.map((item, index) => {
item.value = item.properties.center
// 涟漪特效系列 南京位置开始
item.coords = [nanJingData, item.properties.center]
// 打点颜色
item.lineStyle = { color: colorList[index % colorList.length] }
// 占不需要
// dataList.value.push({
// name:item.properties.name,
// value:item.properties.adcode
// })
})
var option = {
tooltip: {},// 配置提示框,有这个配置项即可
// 地理坐标系配置
geo: {
// 使用注册的地图名称
map: 'JSS',
label: {
show: true,
color: '#ddd',
},
itemStyle: {
areaColor: '#0c4c91',
borderColor: 'rgba(147,234,245,.5)',
borderWidth: 1
},
// 允许缩放和平移
roam: true
},
series: [
// {
// name: '江苏省',
// type: 'map',
// map: 'JSS',// 这个是上面注册时的名字哦,registerMap('这个名字保持一致')
// // 显示标签
// label: {
// show: true,
// color: '#ddd',
// },
// itemStyle: {
// areaColor: '#0c4c91',
// borderColor: 'rgba(147,234,245,.5)',
// borderWidth: 1
// },
// data: dataList.value
// },
// 涟漪特效系列
{
type: 'effectScatter', // 使用特效散点图
coordinateSystem: 'geo', // 使用地理坐标系
data: optionCity.value, // 数据源
symbolSize: 5, // 点大小
showEffectOn: 'render', // 初始渲染时显示特效
// 涟漪特效配置
rippleEffect: {
period: 4, // 动画周期(秒)
scale: 5, // 波纹扩散范围
brushType: 'fill' // 填充式波纹
},
// 标签配置
label: {
show: true,
formatter: '{b}', // 显示数据项名称
position: 'right' // 标签位置
},
// 点样式
itemStyle: {
color: value => {
return value.data.lineStyle.color || '#5abead'
},
shadowBlur: 10,
shadowColor: '#333'
},
// 高亮状态配置
emphasis: {
scale: true // 放大效果
}
},
{
type: 'lines',
coordinateSystem: 'geo', // 新增:指定使用地理坐标系
data: optionCity.value,
// data: [{
// coords: [[118.7969, 32.0603, 50],[119.178821, 34.600018] ,] // 修正为正确的坐标对格式
// }],
effect: {
show: true,
period: 10, // 箭头指向速度,值越小速度越快
trailLength: 0.4, // 特效尾迹长度[0,1]值越大,尾迹越长重
symbol: 'arrow', // 箭头图标
symbolSize: 5 // 图标大小
},
lineStyle: {
color: '#1DE9B6',
width: 1, // 线条宽度
opacity: 0.1, // 尾迹线条透明度
curveness: 0.3 // 尾迹线条曲直度
},
}
]
}
myChart.setOption(option)
})
})
</script><script setup>
import { ref, onMounted, onBeforeUnmount } from 'vue'
import * as echarts from 'echarts'
import GetMap from '../components/GetMap.js'
const chartRef = ref(null)
// 中国主要城市坐标数据
// 打点
const cityData = ref([])
// 坐标
const coordinates = ref([])
// 值
const optionCity = ref([])
const colorList = ['#D88BFF', '#5abead', '#66FFFF', '#48D5FF', '#FFE73D', '#66FFFF']
const dataList = ref([])
onMounted(async () => {
var myChart = echarts.init(chartRef.value)
// 显示 loading 动画
myChart.showLoading()
GetMap.then(res => {
// 执行接口关闭动画
myChart.hideLoading()
// 注册地图数据
echarts.registerMap('JSS', res.data)
console.log(res.data.features, 'res.data.features');
// 南京位中心,
let nanJingData = res.data.features[0].properties.center
// 获取每一个城市的坐标,在已南京为中心打点
optionCity.value = res.data.features
optionCity.value.map((item, index) => {
item.value = item.properties.center
// 涟漪特效系列 南京位置开始
item.coords = [nanJingData, item.properties.center]
// 打点颜色
item.lineStyle = { color: colorList[index % colorList.length] }
// 占不需要
// dataList.value.push({
// name:item.properties.name,
// value:item.properties.adcode
// })
})
var option = {
tooltip: {},// 配置提示框,有这个配置项即可
// 地理坐标系配置
geo: {
// 使用注册的地图名称
map: 'JSS',
label: {
show: true,
color: '#ddd',
},
itemStyle: {
areaColor: '#0c4c91',
borderColor: 'rgba(147,234,245,.5)',
borderWidth: 1
},
// 允许缩放和平移
roam: true
},
series: [
// {
// name: '江苏省',
// type: 'map',
// map: 'JSS',// 这个是上面注册时的名字哦,registerMap('这个名字保持一致')
// // 显示标签
// label: {
// show: true,
// color: '#ddd',
// },
// itemStyle: {
// areaColor: '#0c4c91',
// borderColor: 'rgba(147,234,245,.5)',
// borderWidth: 1
// },
// data: dataList.value
// },
// 涟漪特效系列
{
type: 'effectScatter', // 使用特效散点图
coordinateSystem: 'geo', // 使用地理坐标系
data: optionCity.value, // 数据源
symbolSize: 5, // 点大小
showEffectOn: 'render', // 初始渲染时显示特效
// 涟漪特效配置
rippleEffect: {
period: 4, // 动画周期(秒)
scale: 5, // 波纹扩散范围
brushType: 'fill' // 填充式波纹
},
// 标签配置
label: {
show: true,
formatter: '{b}', // 显示数据项名称
position: 'right' // 标签位置
},
// 点样式
itemStyle: {
color: value => {
return value.data.lineStyle.color || '#5abead'
},
shadowBlur: 10,
shadowColor: '#333'
},
// 高亮状态配置
emphasis: {
scale: true // 放大效果
}
},
{
type: 'lines',
coordinateSystem: 'geo', // 新增:指定使用地理坐标系
data: optionCity.value,
// data: [{
// coords: [[118.7969, 32.0603, 50],[119.178821, 34.600018] ,] // 修正为正确的坐标对格式
// }],
effect: {
show: true,
period: 10, // 箭头指向速度,值越小速度越快
trailLength: 0.4, // 特效尾迹长度[0,1]值越大,尾迹越长重
symbol: 'arrow', // 箭头图标
symbolSize: 5 // 图标大小
},
lineStyle: {
color: '#1DE9B6',
width: 1, // 线条宽度
opacity: 0.1, // 尾迹线条透明度
curveness: 0.3 // 尾迹线条曲直度
},
}
]
}
myChart.setOption(option)
})
})
</script>